At work we use ptxdist for building firmware images for embedded devices. Our own software is built with CMake and my personal Linux desktop of choice is KDE with KDevelop as Integrated Development Environment. This is nothing new and I wrote about different aspects of that in the past. Today it’s about remote debugging.
Introduction
Writing C/C++ software and building it with CMake is well integrated in KDevelop. Running and debugging things on the same host (your personal computer or laptop) from within KDevelop with gdb is smooth. Things get interesting if you do cross compiling, and the software runs on some embedded target which has not enough space for debugger plus debug symbols plus source fragments. You could use NFS, but every now and then we find ourselves in the position where we need to debug something on devices deployed in the field. What you usually do in this case is installing gdbserver on the target and connect to it from the gdb on your host computer.
The command line way
Remote debugging on the command line is easy from within your ptxdist based Board Support Package (BSP) if you are comfortable enough with gdb or cgdb on the shell. The process is basically as described in HowTo: Debug core dumps with ptxdist 2017.07.0 already, you call ptxdist with the argument gdb. For remote debugging you would do this:
- Build gdbserver for your target by selecting it from the menu (like with your other target packages)
- Start gdbserver on the target e.g. like this:
gdbserver 192.168.10.184:12345 mytool --my-arguments - Start gdb on the host from your BSP workspace:
ptxdist gdb - In the gdb command line connect to gdbserver like this:
target remote 192.168.10.184:12345 - Use gdb as usual (set breakpoints, run, inspect, etc.)
The magic of choosing the correct gdb suitable for the target and setting the necessary options for finding debug symbols and getting paths right is done by ptxdist in step 3. Maybe all this could go to ptxdist’s documentation, but it’s more or less straightforward for experienced developers.
Using KDevelop to edit CMake based projects in your ptxdist BSP
Before we come to debugging, we start with importing a CMake project from the BSP into KDevelop. Please make sure everything builds fine first, a ptxdist go should be completed without errors to have everything in place.
For demonstration I’ll import mosquitto, because it’s a CMake project. I first enabled PTXCONF_MOSQUITTO and let ptxdist built it once.
Then in KDevelop I choose Open / Import Project … and a dialog pops up. The project file I select is /path/to/my/BSP/platform-xyz/built-target/mosquitto-2.0.5/CMakeLists.txt and I usually just select the main CMakeLists.txt of a project here.
CMake projects are usually built out-of-tree, so the source file folders are not clobbered with build artefacts and ptxdist does OOT builds too. In the next dialog KDevelop asks for a build directory, but the suggested one is not the one ptxdist uses. We should select the one from ptxdist however, which in this case is /path/to/my/BSP/platform-xyz/built-target/mosquitto-2.0.5-build and it’s always directly next to the source dir in ptxdist just with -build appended. In that dialog KDevelop tells us now: „Using an already created build directory.“ and that’s exactly what we want here, because ptxdist already set this up with the necessary cross-compiling options.
You could use that to actually code in that source tree now, and even let KDevelop build it locally. That’s a whole other can of worms however and out of scope of what we actually wanna show in this blog post (remote debugging).
Remote debugging with KDevelop
If you never used gdb from within KDevelop before, you should read Running programs in KDevelop and Debugging programs in KDevelop from the KDevelop documentation first.
So, create a Launch Configuration, name it as you like it, instead of using some project target as executable, select „Executable“ and use the binary from the BSP root folder, e.g. this in case of mosquitto_pub (we just use this as example now): /path/to/my/BSP/platform-xyz/root/usr/bin/mosquitto_pub
Then go to the Debug dialog of that Launch Configuration which should look like this somehow:
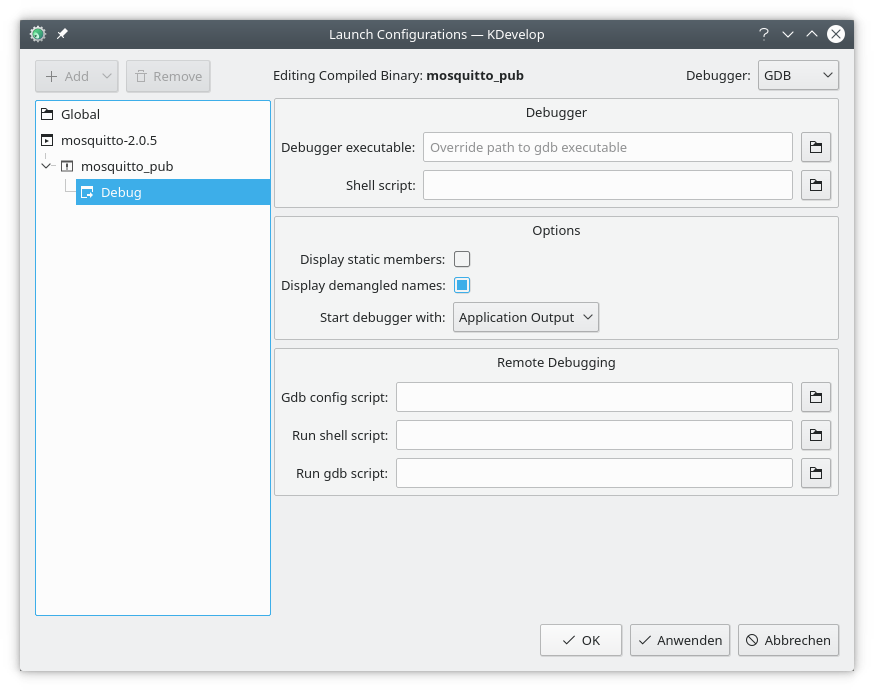
As Debugger executable we select the one from the toolchain. Easiest is to click through to your BSP folder, then further to platform-xyz/selected_toolchain and from there choose the gdb. In my case I have
/path/to/my/BSP/platform-xyz/selected_toolchain/arm-v7a-linux-gnueabihf-gdb
here, which actually is in
/opt/OSELAS.Toolchain-2020.08.0/arm-v7a-linux-gnueabihf/gcc-10.2.1-clang-10.0.1-glibc-2.32-b
inutils-2.35-kernel-5.8-sanitized/bin
but it’s a lot easier to use that selected_toolchain symlink here.
Up to here that was the „easy“ part. The main thing I struggled with a lot comes with those three scripts for Remote Debugging seen in the lower half of the dialog. You put those in three different files and those can reside anywhere you like. Let’s dive in.
Gdb config script
The Gdb config script is used to setup gdb and you can think of it like things done before gdb is started. The KDevelop help if you hover over it says: „This script is sourced by gdb when the debugging starts.“ We will put the same in here ptxdist uses when calling gdb, but have to add some more. This is essential. If you don’t get this right, things will not work as expected.
set debug-file-directory /path/to/my/BSP/platform-xyz/root/usr/lib/debug
add-auto-load-safe-path /path/to/my/BSP/platform-xyz/root
set sysroot /path/to/my/BSP/platform-xyz/root
set substitute-path platform-xyz /path/to/my/BSP/platform-xyz
directory /path/to/my/BSP
The first four lines do the same what ptxdist does when calling it with the gdb argument. The last line is exceptionally important, because KDevelop is not started from the BSP workspace directory as it’s the case when calling ptxdist gdb. This is essential however, because since ptxdist-2018.10.0 you only have paths relative to your BSP in the debug symbols. If you don’t add that extra directory gdb started by KDevelop won’t find the source files and breakpoints won’t work. (You can set the breakpoints in KDevelop, but gdb does not find the source files as communicated by KDevelop. Result is: breakpoints stay pending and execution is not interrupted. If you set the breakpoints manually through the GDB console, execution is interrupted, but KDevelop does not jump to the correct source lines. Both not satisfying.)
(Debugging without that directory line probably works when calling ptxdist gdb from the BSP workspace folder, because gdb has some paths added automatically. See Specifying Source Directories from the gdb documentation and especially the section about two special entries ‘$cdir’ and ‘$cwd’.)
Run shell script
The Run shell script can be used to let KDevelop start the application on the remote target. This works with ssh for example, but is only smooth if that connection can be made without typing a password. One example to put into such a script:
ssh root@192.168.10.185 'gdbserver 192.168.10.185:12345' /usr/bin/mosquitto_pub -h 192.168.10.74 -t 'hello' -m 'world'
Consider this optional. You might as well start gdbserver on the target manually with whatever options you need. (This is different for example if you want to attach to an already running process.)
Run gdb script
This is executed by KDevelop on your behalf, usually to connect to the remote gdbserver. You could as well type it into the GDB console in KDevelop. This is what you could put in such a script:
shell sleep 3
target remote 192.168.10.185:12345
Aftermath
The whole thing caused me some headaches, especially because things changed when ptxdist introduced layers back in late 2018. However it’s a lot more comfortable to debug in the same environment as you code and especially inspection of frame stacks and variables is much more comfortable in a graphical environment than on the console. I think it’s worth the effort and maybe this HowTo helps someone else to use a similar setup.
You can of course create those three files manually. What we did at work was writing a shell script creating those from some template, so we can recreate them again with different settings for hosts, binary paths, etc. This is not complicated however, you can do that by yourself.